
I.P.C., Internet Protocol City, site web, 2008.
http://www.reynalddrouhin.net/works/ipc/
From an IP collection, a city will be generated : I.P.C is this city. The goal of I.P.C is to make visible an utopic, a virtual, a global city, made of connexions and in a perpetual progression. The city will have a center, a periphery, and a growing community.
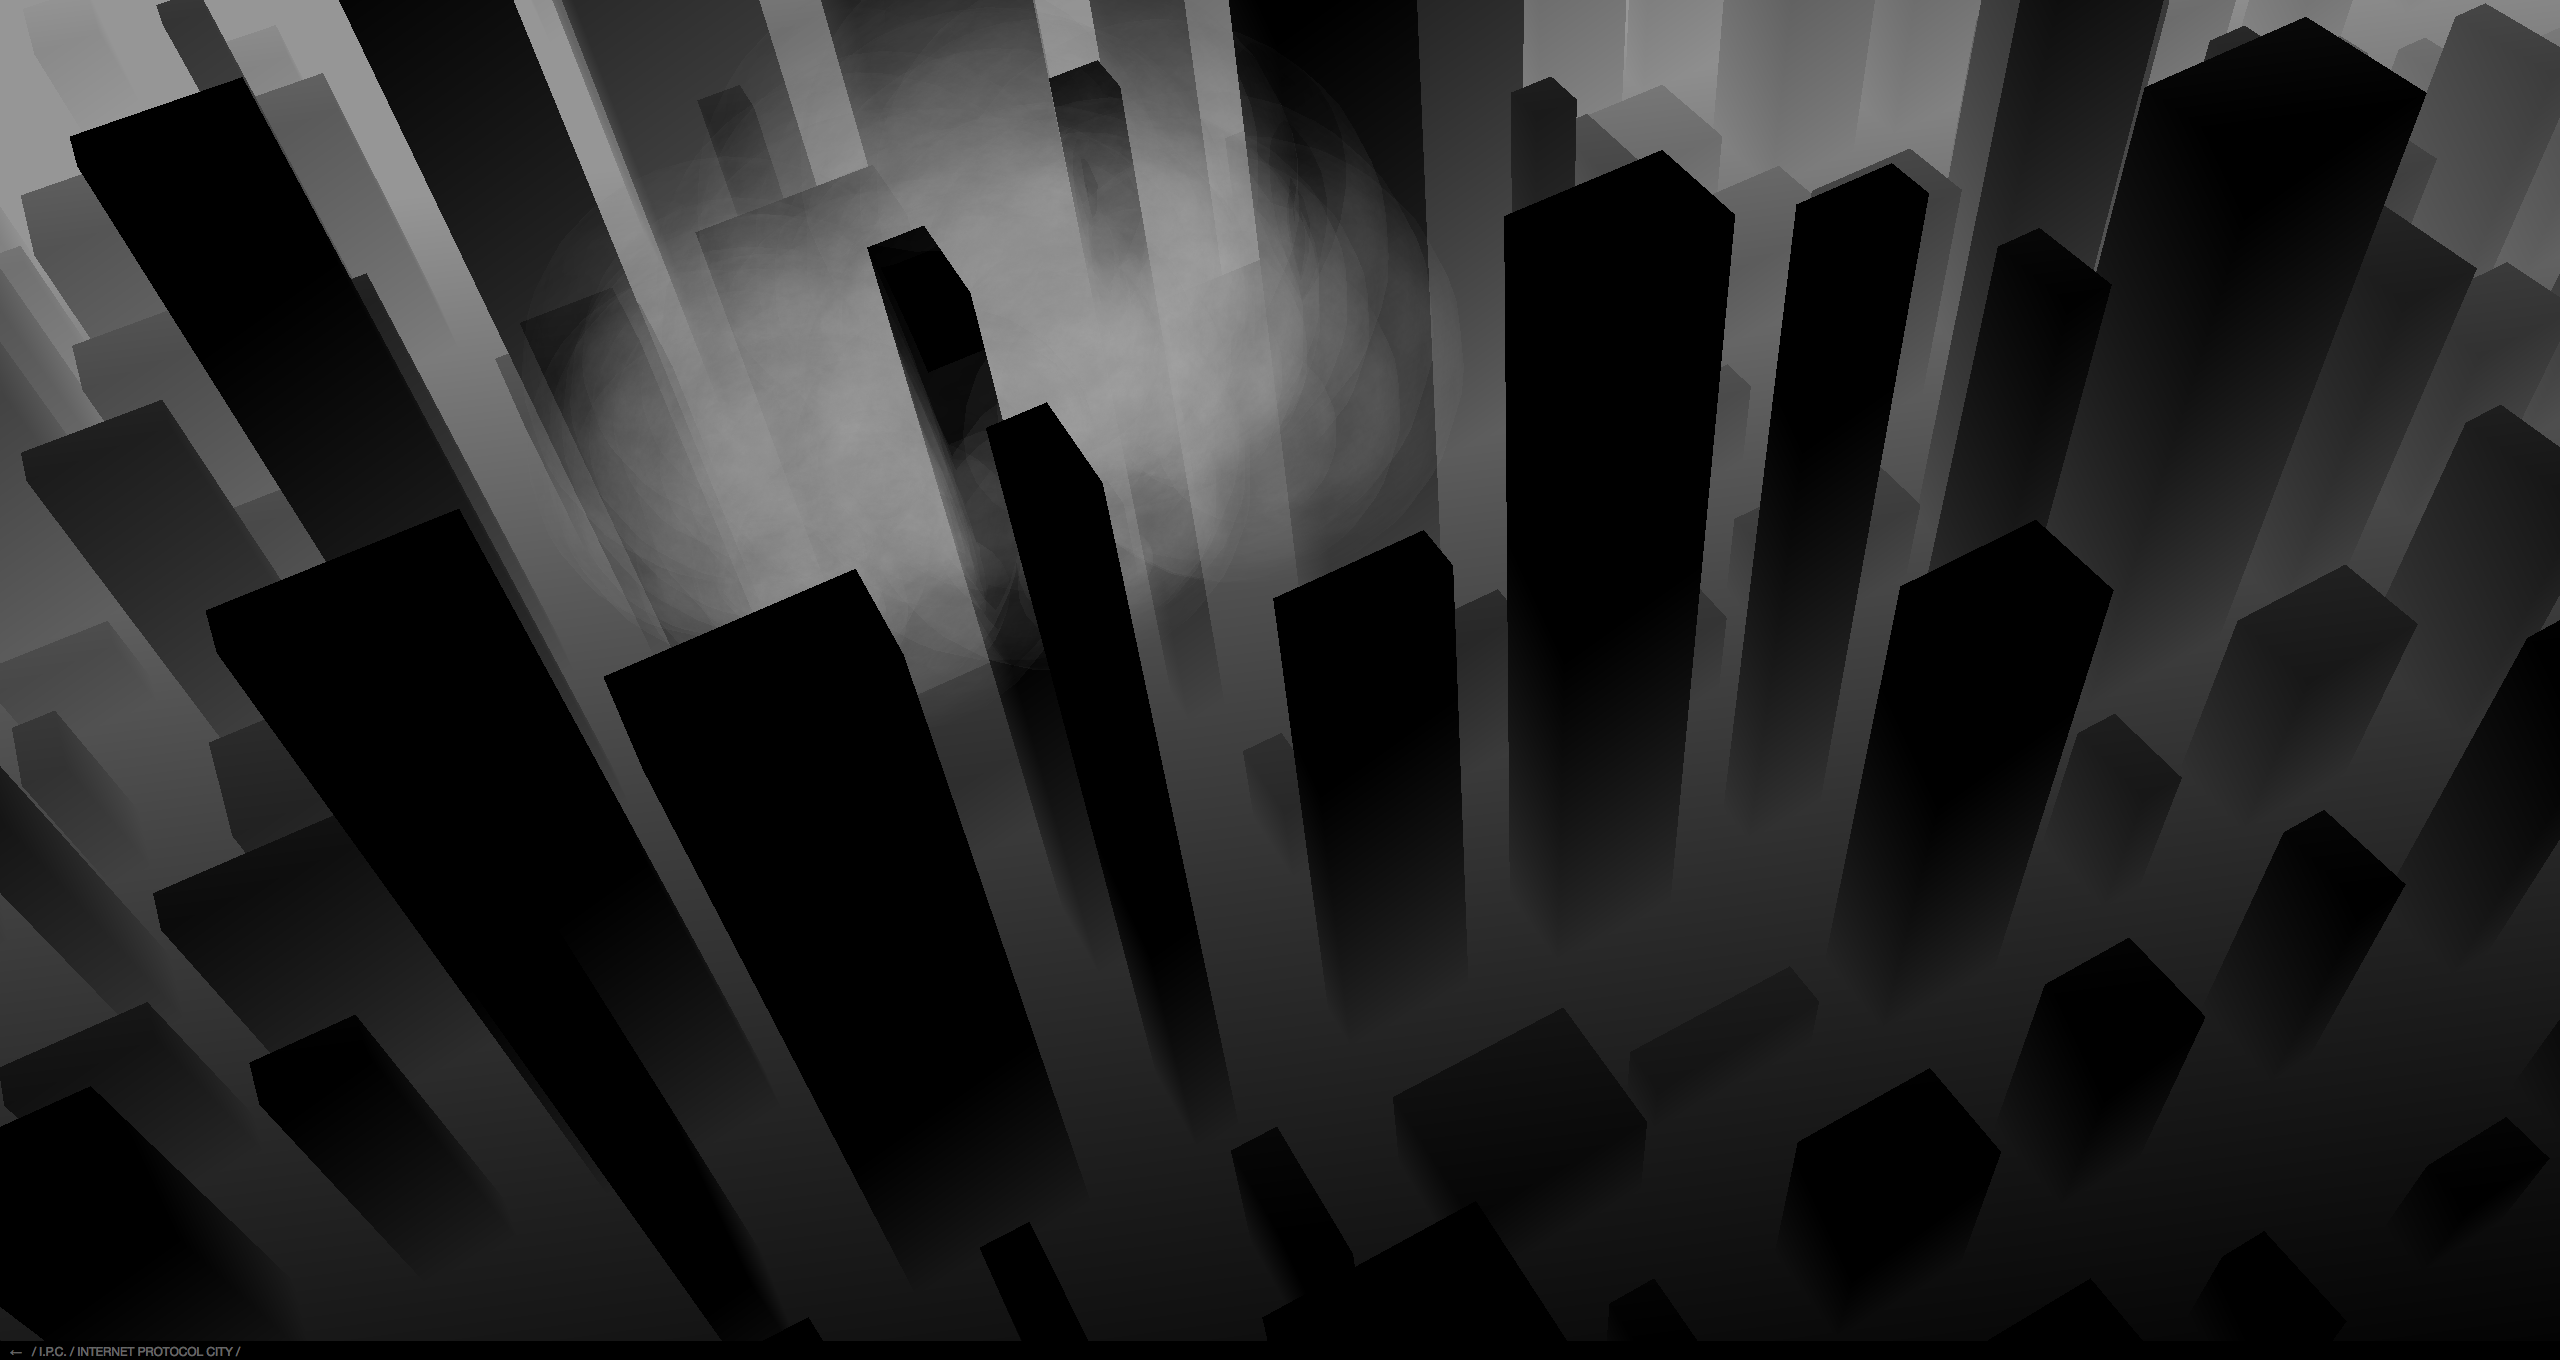
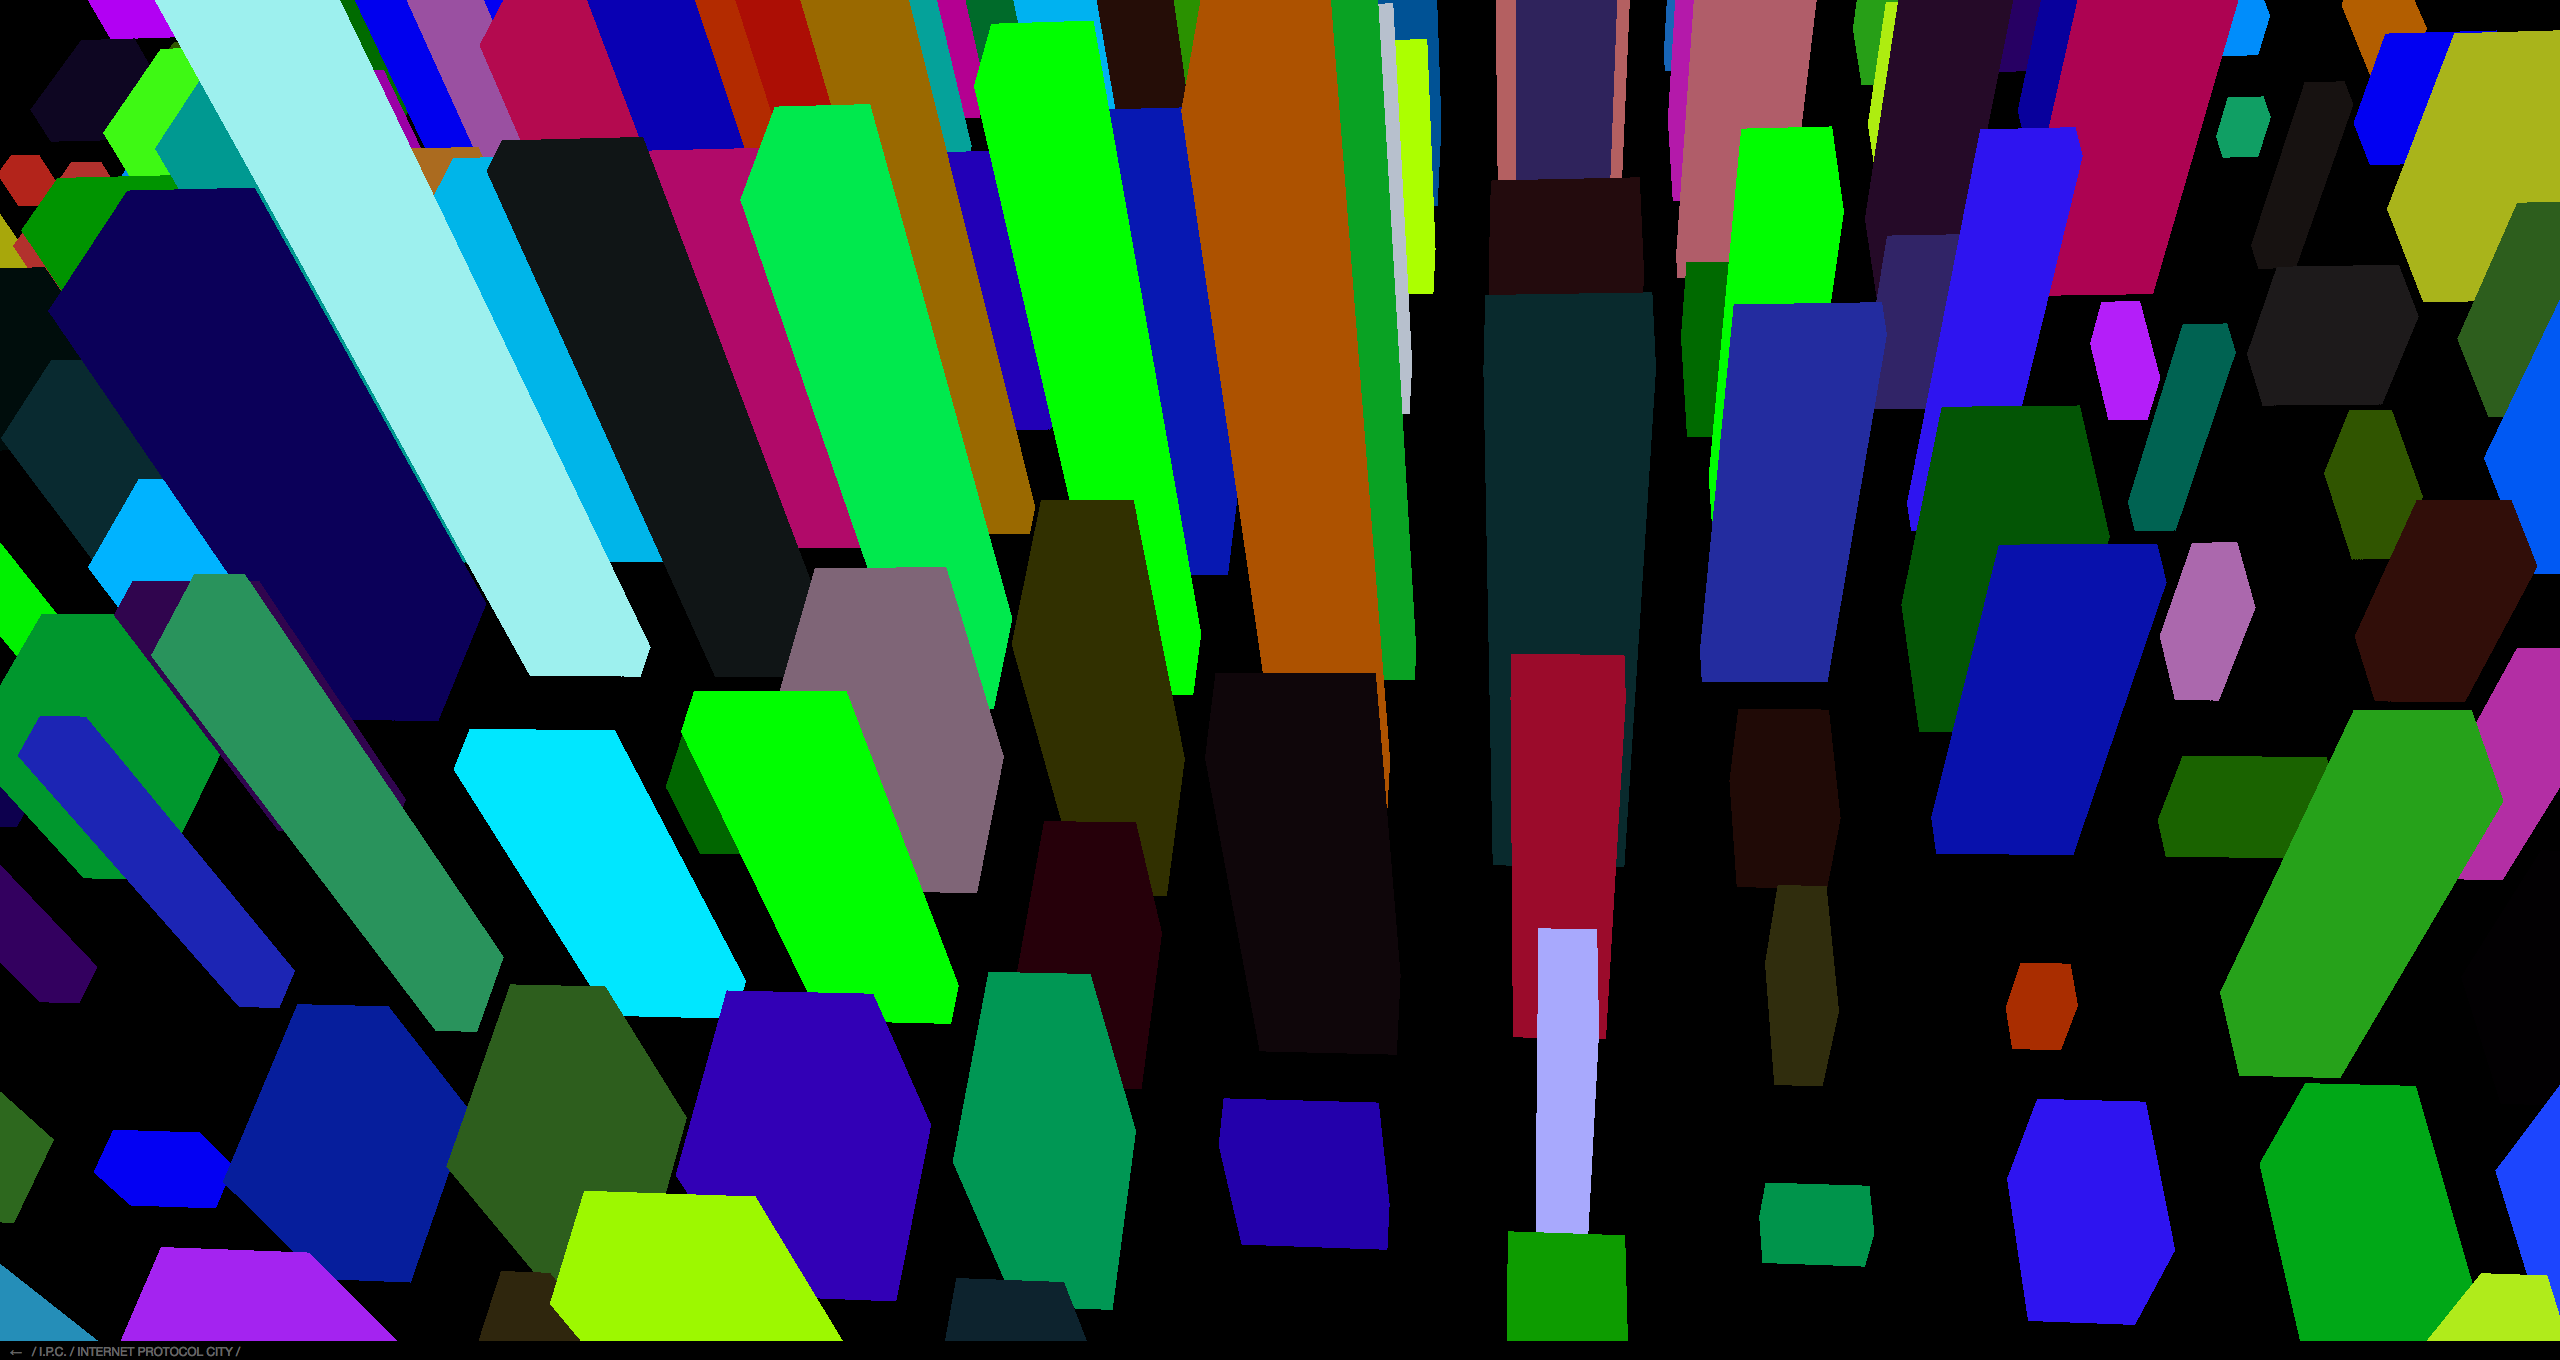
« I.P.C. est un générateur de villes fantômes qui transforme le n° IP des internautes en buildings monochromes, I.P.C. (Internet Protocol City) est davantage un archipel numérique qu’une cité. Les différentes visualisations d’I.P.C. correspondent aux 256 dernières connexions enregistrées. Grâce à l’identification des n° IP, I.P.C. devient l’illustration la plus littérale du village planétaire de Marshall Mc Luhan. Des internautes du monde entier cohabitent dans ce cyberterritoire sans le savoir. » (Carole Rinaldi)
Ville / Internet / Utopie / Cité idéale
La ville est l’“ossature matérielle” d’une société. Cette ossature peut être représentée sous forme de réseau : des chemins, des enclos, des frontières.
Mais ce réseau matériel ne détermine pas la manière suivant laquelle il est “utilisé” : les “règles du jeu”. Il est alors accompagné d’un autre réseau, celui-là immatériel.
“Si le réseau matériel de la ville est relativement immobile, peu ouvert aux changements, le réseau immatériel, celui des communications, est éminemment flexible.” (1)
Et c’est par ce biais que “I.P.C. (2)” va tenter de rendre visible cette immatérialité du réseau, des connexions, des flux, des déplacements vont être enregistrés, différents moyens de captations et d’enregistrements vont être mis en oeuvre : sous forme d’un site web (3D) mais aussi de photographie, de vidéo Haute Définition ou encore de sculpture.
Contrairement à ce que l’on entend souvent affirmer, l’Internet ne baigne pas dans le futur, mais dans le présent ; il n’annonce pas des jours meilleurs mais une clarté perpétuelle, polaire, révélant crûment la société à elle-même.
Dans ce mouvement perpétuel I.P.C. va permettre de capturer de saisir des instantanés de vies au delà des villes, I.P.C. va devenir la ville des villes… une “cité idéale” (3)
“Mais en même temps qu’ils semblent entériner l’épuisement définitif de l’utopie (4), les nouveaux réseaux d’information font ressurgir des attentes que l’on croyait mortes, le désir de redonner un sens à la vie individuelle et collective, des rêves de transparence et de communication universelle. Il y a très probablement de l’utopie à l’œuvre dans l’Internet. Cette utopie présente un caractère urbain. Elle tend à nous dire quelque chose sur les villes et sur leur devenir…” (5) comme l’affirme dans cette citation W.-J. Mitchell, le projet I.P.C. va mettre en lumière le lien inaltérable qu’entretien Internet et la ville.
Les réalisations plastiques issues de ce projet global vont permettre de voir cette réalité caché : le subtile maillage entre l’espace urbain et le cyberespace (6).
“Ce que l’on voit provient de ce qui n’est pas apparent.” Paul de Tarse
Réaliser une suite, « complément » au projet « IP Monochrome ».
I.P.C. va être connecté à IP MONOCHROME : un site web collectionnant des monochromes générés lors de la connection (visite) de chaque internaute.
L’adresse ip (Internet protocol (7)) est le numéro personnel attribué à chaque ordinateur qui se connecte à Internet. Celle-ci est récupérée lors de la visite de l’utilisateur sur le site et est traduite en code couleur html. La couleur alors générée est un monochrome qui viendra s’accumuler dans une base de donnée, une galerie archivée, une collection de connexion.
Ce projet conceptuel permet de générer des monochromes “uniques” puisque dépendant de l’adresse ip du visiteur. IP Monochrome est un projet participatif, génératif, évolutif, expansif…
A partir de ces “collections” d’IP. : une ville (8) va être générée : I.P.C. est cette cité.
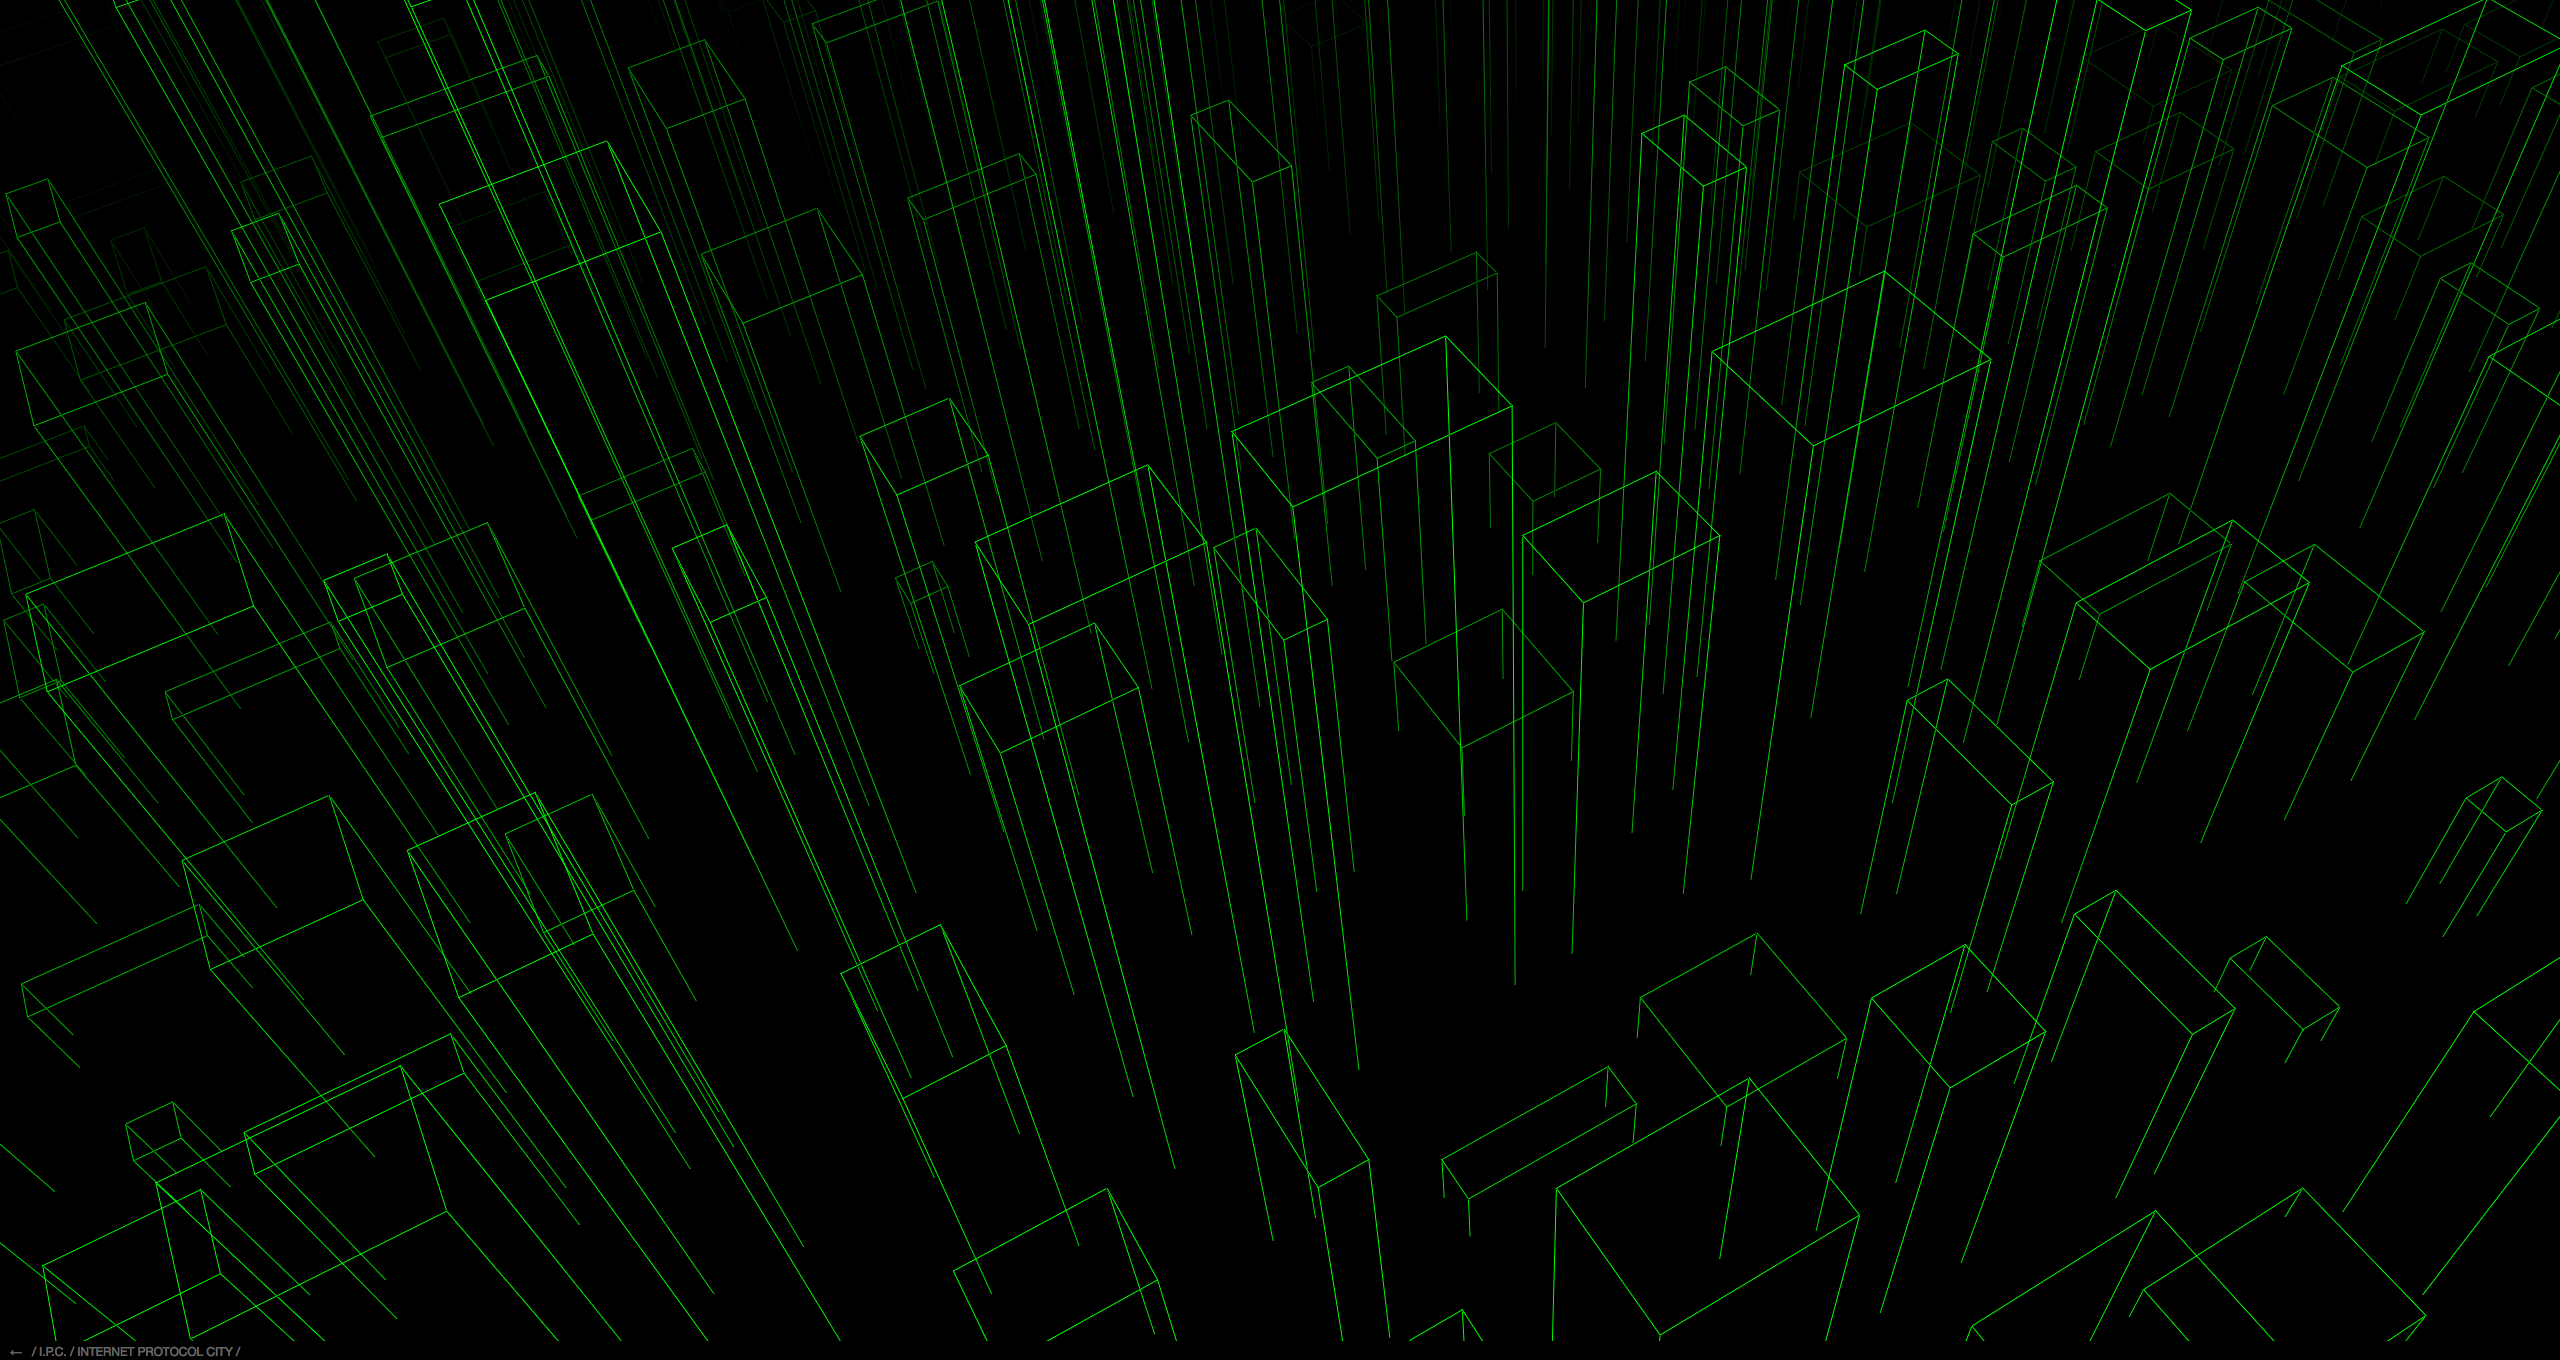
I.P.C. va permettre des visualisations protéiformes (en 3D, en plan, en perspective : en monolithes colorés, en monolithes noirs, en filaire)
I.P.C. a pour but de rendre visible une ville utopique, virtuelle, globale, faite de connexions et en progression perpétuelle…
Le démarrage dans cette promenade “virtuelle” sera, pour le spectateur, son propre point vue (en mode « actif »), walk, fly, il aura la faculté de se déplacer dans cet “autre” espace urbain ; et un mode « passif » : il y aura un seul point de vue du type surveillance : control.
La ville aura un centre, une périphérie mais aussi une communauté grandissante…
1) in Utopies réalisable, Yona Friedman.
2) Internet Protocol City.
3) La Cité idéale est une aspiration à la perfection architecturale, sociale (morale) et politique. La réalisation d’une cité idéale est un des grands rêves des sociétés urbaines ou en voie d’urbanisation. Le terme pourrait sembler synonyme d’utopie si certaines de ces cités n’avaient été construites dans les faits. Il s’agit cependant de réalisations idéales au sens où, contrairement à la cité spontanée, qui se développe peu à peu selon les besoins en fonction de décisions multiples, et donc de façon organique et parfois anarchique, la cité idéale se conçoit avant de se construire, et sa fondation résulte d’une volonté unifiée.
4) L’utopie est une représentation d’une réalité idéale et sans défaut. Une utopie peut être un régime politique idéal (qui gouvernerait les hommes parfaitement), une société parfaite (sans injustice par exemple, comme la Callipolis de Socrate) ou aussi une communauté d’individus vivant heureux et en harmonie. Une utopie peut désigner également une réalité inaccessible et irréalisable : en ce sens qualifier quelque chose d’utopie consiste à le disqualifier et à le considérer comme un rêve impossible à concrétiser.
5) Cf. W.-J. Mitchell, City of bits. Space, place and the infobahn, Cambridge, Massachusetts, The M.I.T. Press, 1995 ; in Les utopies urbaines, entre crise et renouveau (Extrait d’un article paru dans La Revue des deux mondes, avril 2000, pp. 110-117.
6) cyberespace désigne, d’après le Petit Robert, un « ensemble de données numérisées constituant un univers d’information et un milieu de communication, lié à l’interconnexion mondiale des ordinateurs ».
7) IP (Internet Protocol, protocole Internet) Il existe deux versions d’IP actuellement utilisées : IPv4 et IPv6. La première est la plus utilisée sur Internet, mais, pour des raisons de disponibilité des adresses IP (grosso modo autour de 2564 soit environ 4 milliards de combinaisons possibles théoriques maximales avec IPv4), IPv6 émerge tout doucement. Il y avait déjà eu dès la fin des années 1980 une grave pénurie d’adresses de classe 2 (2 octets de numéro de réseau, et 2 octets de numéro d’adaptateur sur le réseau), dont on n’avait pu sortir qu’avec l’astuce de CIDR (Classless Internet Domain Routing) et en surchargeant les mémoires des routeurs.
8) Une ville est une unité urbaine étendue et fortement peuplée (par opposition aux villages) dans laquelle se concentrent la plupart des activités humaines : habitat, commerce, industrie, éducation, politique, culture. En France, l’INSEE délimite la ville selon la continuité de l’habitat.
Programmation, développement director : Vadim Bernard
Développement php pour la base de donnée : Loïc Horellou
Projet réalisé avec le soutien de Arcadi, numeriscausa et Incident.net
Capture vidéo du projet en 2012 :
Reynald Drouhin
http://nt2.uqam.ca/fr/repertoire/ipc-internet-protocol-city
AUTEUR·E·S: GALAND, SANDRINE
Fiche simple
Internet Protocol City (I.P.C.) est un générateur de villes fictives qui transforme l’adresse IP des internautes se connectant à l’oeuvre en immeubles monochromes. À la suite du projet IP Monochrome, Reynald Drouhin désire, avec ce nouveau projet, explorer ce qu’il nomme «l’ossature immatérielle» d’une société. Les multiples monochromes générés par IP Monochrome sont repris dans I.P.C. et érigent une ville 3D que l’internaute peut découvrir à pied ou à vol d’oiseau, contrôlant sa navigation avec sa souris et les flèches du clavier. IP Monochrome et I.P.C. permettent toutes deux une matérialisation des traces «immatérielles» propres au Web, scellant ainsi davantage le lien entre la ville et le Web. Notons que chaque nouvelle visualisation d’I.P.C. (l’internaute peut rafraîchir la ville en appuyant sur la barre d’espacement) correspond au 256 dernières connexions enregistrées.
Reynald Drouhin
https://techcrunch.com/2016/05/08/the-digital-age-of-data-art/
The digital age of data art
Posted May 8, 2016 by Maxence Grugier
Many artists use as material for art the raw data produced by our societies, seeking innovative means of display or transforming it into a work of art. By blurring boundaries between art and information, data art dispels the myth of the romantic artist while offering a fundamental artistic act in a critical commentary of the digital age in which we live.
An age that is supposedly open and yet increasingly obscure or incomprehensible to non-specialists. By re-appropriating these reams of information, or big data, data artists reintroduce fantasy to an age of increasingly abstract data and concepts.
The objective of data art is to create aesthetic forms and artistic works from the digital nature of the data generated from big data (graphics, simulations, worksheets, statistics, etc.). Any virtual data produced by our environment can be transformed into images, objects or sounds. Data art also presents the underlying links that exist between the ubiquitous algorithms in our lives — figures from databases, raw data, data collected by search engines, calculations and statistics (geographical, political, climatic, financial) and artistic creation.
Natural disasters around the world. Image from the exhibition EXIT. At the Palais de Tokyo (November 2015 / January 2016)
Natural disasters around the world. Image from the exhibition EXIT. At the Palais de Tokyo (November 2015 / January 2016).
Art and information technology are still unfortunately widely perceived as evolving in two conflicting worlds, but a new generation of artists working in the field of electronic media cannot afford to consider the world — and art — in these terms. Using media and IT tools is a creative process that is natural for them (this usually involves information technology: software development; programming; data analysis; algorithms; documentation and meta-data retrieval on the Internet, etc.).
This still-emerging aesthetic trend offers a new interpretation of the increasingly “mathematical” and rationalist world in which we live, re-enchanting the everyday life of homo technologicus. For these artists, this techno-scientific vision only touches the surface of another, much more complex, secret and marvelous world — a world that also speaks volumes, a world of data and information.
Algorithms and data flow
The world in which we live is almost entirely governed by algorithms. An algorithm is a sequence of computer instructions, applied systematically by a machine, or by software. In the past, an operator instructed a computer and commands were performed. With algorithms, the computer carries out automatic tasks alone, unassisted.
Some algorithms are the syndication’s key participants (subscription to a data flow; for example, RSS flow). They search for information and send it to the user registered on a “syndication feed.” Of course, other algorithms pick up the same data. These programs capture — and therefore propose — content, according to prior choices made by the user (on Google, Amazon, Facebook, Yahoo, etc.); these are flow aggregators and big data collectors.
The current quantitative explosion of digital data streams requires new ways for this information to be visualized. The processing of the research, retrieval, storage and analysis of this data is still an emerging sector, but it provides work for evaluation and analysis specialists, as well as for artists. Processing this extremely complex and diversified data is responsible for a brand new economic sector emerging in the field of information technology, along with new forms of artistic creation.
The treemap represents hierarchical data in a limited space, invented by Ben Shneiderman
The treemap represents hierarchical data in a limited space, invented by Ben Shneiderman.
Data visualization, the first step in data art
Data visualization has become a fundamental discipline as more and more businesses, local councils and public services are forced to invent visually amusing and striking ways to classify dig data generated by the movements in populations, their patterns of consumption, communication and travel, etc.
The first step in the world of data art consists of addressing how to view this data. Amongst the pioneers of this discipline, previously solely scientific and devoted to graphical representations of statistical data, are theorist Edward Tufte, responsible for the creation of sparklines (a concise graphic format developed for insertion in text), and Ben Shneiderman, who invented treemap in 1990.
Amongst the other graphical representation techniques and terminology, there are bar charts, pie charts (better known as Camembert or Donut Chart), scatter graphs, lines, bubbles, heat maps, (mapping of “hotspots”), etc. They all refer to the different ways of making visually attractive and, above all, understandable the reams of data (also called “datascapes”) that shape our everyday lives.
Data visualization, often generating extremely complex graphics, sometimes becomes artistic. Matt Willey, for example, draws inspiration from these forms with At This Rate and 2060 Poster, to show the impact of the economy and human activities on the environment.
Matt Willey, 2060 Poster, Poster produced to raise awareness of the destruction of the Amazon rainforest.
Matt Willey, 2060 Poster. Produced to raise awareness of the destruction of the Amazon rainforest.
The origins of data art
To give a timeline to the origins of what is today known as data art (also called information art or informatism), reference should be made to the minimalist artist Kynaston McShine and his exhibition “Information,” given at the MoMA in 1970.
By choosing to present the combination of science, informatics and information technology with the most classical forms of art (including performance art, visual art, digital art and conceptual art), McShine proposes a first definition of data art. In the MoMA exhibition catalogue, he wrote: “Increasingly artists use mail, telegrams, telex machines, etc., for transmission of works themselves — photographs, films, documents — or of information about their activity.”
For Kynaston McShine, art and information already formed one single progressive movement, in a period literally “made of information.” Other signs of data art are also apparent amongst pioneers of generative art, an artistic form calling upon computer-generated creation via algorithms and computer language.
Mark Napier, Black and White, generative art ( 2003)
Mark Napier, Black and White, generative art (2003).
However, before the advent of today’s extremely complex forms of data art, there were works like those by the artist Mark Napier, part of the generative art movement, who produced Black and White, a work based on the stream of information captured by “Carnivore,” a software program developed by the FBI in the 2000s.
Julian Oliver, Packet Garden Data Art, making the intangible visible
Julian Oliver, Packet Garden. Data Art, making the intangible visible.
An increasing number of facets of our existence interact with each other through the multiple flow networks forming today’s information landscape. A historical and technological context that inspired Julian Oliver, for example, with Packet Garden, a project depicting our movements on the web portrayed as incredible engineered gardens, and Jason Salavon who, with American Varietal, offers a creative view of American ethnic plurality.
Jason Salavon, American Varietal, 2013 / Real-time interactive system, structural steel, multi-touch screen.
Jason Salavon, American Varietal, 2013 / Real-time interactive system, structural steel, multi-touch screen.
These intricately linked communication and movements are then assembled in huge databases by the algorithmic machine. This is what, for example, inspired one of the pioneers of data art, Aaron Koblin, with Flight Patterns (2009), a data art classic visualizing air traffic, a material representation of worldwide communication.
Flight Patterns – Color from Aaron Koblin.
Others, like the German artist Stefan Sagmeister, wish to resume the immaterial and abstract appearance of figures, streams and data recovery program. Move Your Money is a humorous, 3D inflatable metaphor — based on children’s bouncy inflatable castles — to make international monetary flows tangible.
Love Will Tear Us Apart Again, Peter Crnokrak
Love Will Tear Us Apart Again, Peter Crnokrak.
In a more amusing — and rock ‘n roll — way, with The Long Black Veil, the artist Jeffrey Docherty creates an intangible map of the 1980s Punk and New Wave scene. Love Will Tear Us Apart Again by Peter Crnokrak is a diagram of the emotional impact of the resumption of Joy Division hit Love Will Tear Us Apart in different countries and by different interpreters. With Serendipity in 2014, Kyle McDonald proposes a map connecting people listening to the same piece at the same time on Spotify.
Poetic flows
Creative apps and imagination are considerable in this field. The goal of data art, inspired by very down-to-earth techniques to visualize data, is above all to make the invisible visible. However, by formatting these reams of data, data artists are not content with making legible the mesh of information from which it is formed, they also take a critical look at our society.
By appropriating this intangible flow of data, data artists position themselves as observers and testify to behaviors, inferring details about mankind, the eternal demiurge — whether artists or sociologists, mathematicians or business men — for whom data collection indicates a compulsive need to control their even most abstract environment.
Jonathan Harris &Sepandar Kamvar, WeFeel Fine, net mapping the net collecting Internet sentences beginning with « I feel » or « I am feeling ». Nearly ten million feelings and more than two million blogs were thus collected.
Jonathan Harris and Sepandar Kamvar, We Feel Fine, net mapping the net collecting Internet sentences beginning with “I feel” or “I am feeling.” Nearly 10 million feelings and more than two million blogs were collected.
However, with the evolution of generative graphics and data capture techniques, contemporary data art artists sometimes go beyond criticism to deliver instantly beautiful works of art that speak for themselves… almost.
This is the case with Jonathan Harris and Sepandar Kamvar, with We Feel Fine, an exploration of human emotions, or Reynald Drouhin with Internet Protocol City, a generator of “ghost towns” transforming the IP addresses of Internet users into monochrome buildings, when abstract and cold data changes into the pure state of metaphoric beauty.
Jean-Baptiste Luneau and Malo Girod de l’Ain contributed to this post.